Observation Proposal (part 2)
Daniel Wysocki • • assignment
I have updated my proposal from last time.
I had mistakenly chosen a telescope at CTIO, when I had meant to choose one at KPIO.
I am also now restricting myself to the V- and I-bands.
In calculating the needed exposure times, I have assumed the brightness is constantly its faintest (4.37 mag), the highest airmass (14), a seeing of 10 arcseconds, and a constant lunar phase of 7 days to new moon (half moon). I give room to obtain an SNR of 500. Based on these results, I find that the necessary exposure times are 0.04 seconds for the V-band, and 0.02 seconds for the I-band. Allowing for some time to change filters, I estimate that we may take 1 image every 5 minutes, and 1 image in both filters every 10 minutes.
ccdtime output:
Database: kpno.db  Telescope: 0.9m        Detector: MOSAIC1_1
  Sum: 1   Arcsec/pixel: 0.42  Pixels/star: 777.0
  Seeing: 10.  Airmass: 14.0  Phase: 7.0

 Filter    Time     Mag     SNR    Star Sky/pix    Noise contributions
                                                   Star     Sky     CCD

      U   37.57     4.4   500.0 267488.3     0.0  517.19    5.11  136.70
      B    0.16     4.4   500.0 267443.8     0.0  517.15    2.26  136.59
      V    0.04     4.4   500.0 267444.9     0.0  517.15    2.54  136.59
      R    0.02     4.4   500.0 267450.1     0.0  517.16    3.51  136.59
      I    0.02     4.4   500.0 267463.8     0.0  517.17    5.29  136.59
      z    0.02     4.4   500.0 267557.5     0.2  517.26   11.61  136.59
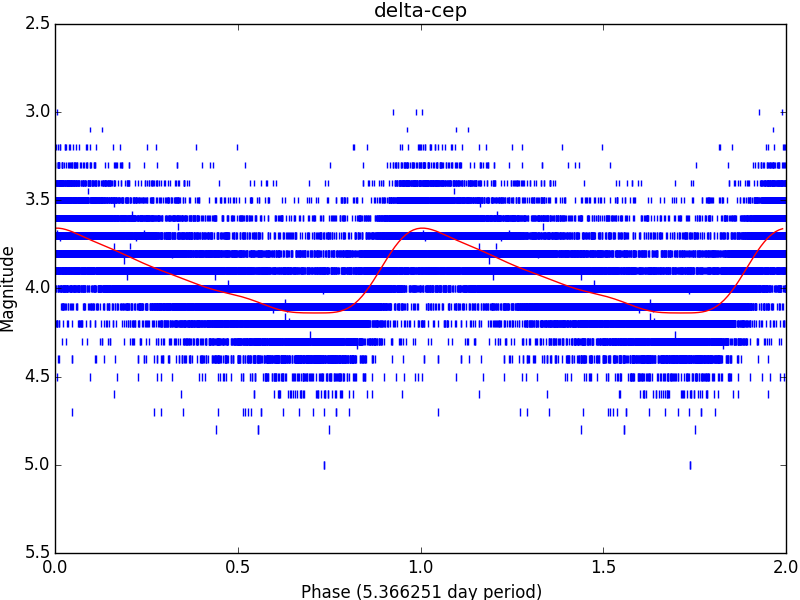
I have also obtained some photometry from the AAVSO (photometry), with the intent of using it to predict what my observations will look light, and generate some artificial data. I ran the data through a package I helped create for fitting variable star light curves (plotypus), using the script aavso-fit.sh, which was run as follows:
bash scripts/aavso-fit.sh data/aavsodata_5611d453a3156.txt \
                          data/delta-cep.dat \
                          data/plotypus_table.dat \
                          img/
This generated the following plot:
The proposal can be found here: